Education only, not financial advice. Figures come from official sources, each with its date; past market moves do not predict future ones. How we work
The supply chain crisis after COVID peaked in December 2021, when the New York Fed's Global Supply Chain Pressure Index (GSCPI) reached 4.43, the highest reading in its history. It eased through 2022, and in February 2023 the index fell below its historical average for the first time since before the pandemic.
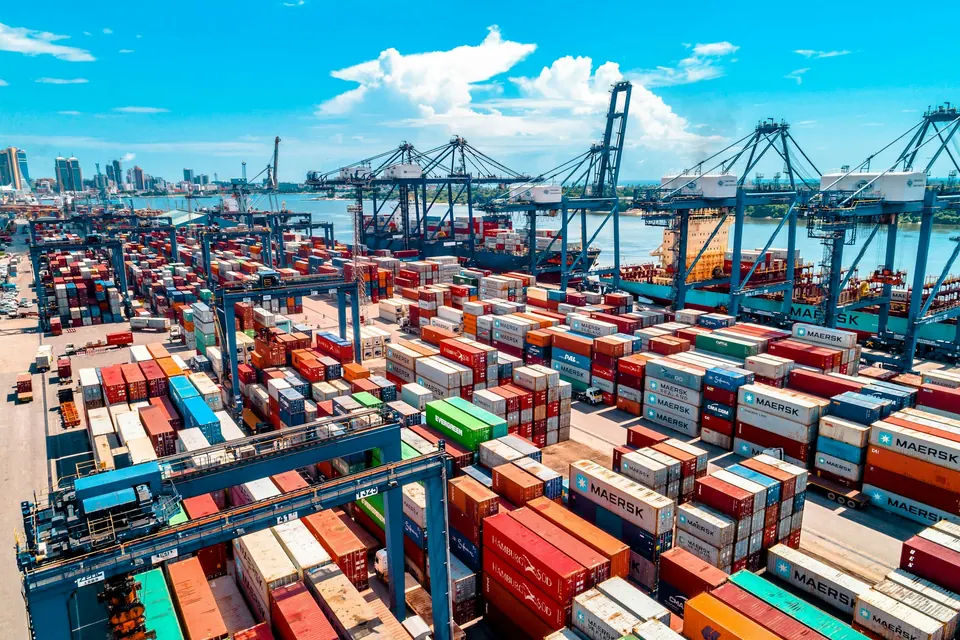
The crisis showed up as long delivery times, high shipping costs and sharp price rises for goods such as cars. This page uses the New York Fed's index to date it and relies on Federal Reserve, BIS and BLS publications for what happened and why.
How is the supply chain crisis measured?
The GSCPI was introduced by economists at the Federal Reserve Bank of New York in a Liberty Street Economics post on January 4, 2022. It combines 27 variables into one number. Six measure transport costs: the Baltic Dry Index (the cost of shipping raw materials), the Harpex index (container shipping rates) and BLS airfreight price indexes for routes between the US, Asia and Europe. The other 21 come from purchasing managers' surveys in seven economies (the euro area, China, Japan, South Korea, Taiwan, the UK and the US): delivery times, backlogs and purchased stocks. The authors adjust these for demand using survey data on new orders, so the index tries to isolate pressure on the supply side.
The units are standard deviations from the historical average. A reading of zero is a normal month. A reading of 1 is unusually tight. Before the pandemic, the highest reading in the published data was 1.58, in April 2011, after the earthquake in Japan. The authors wrote that earlier spikes "pale in comparison" with what was observed after COVID-19 began.
Source: Federal Reserve Bank of New York, GSCPI. Chart drawn by coronavirus.markets from the official file downloaded on October 6, 2026.
What happened to supply chains in 2020?
The index was at 0.02 in December 2019, almost exactly normal. It jumped to 2.60 in March 2020 and 3.34 in April 2020, as factories closed and transport was disrupted in the first wave of lockdowns. By September 2020 it had fallen back to 0.63. At that point the problem looked temporary.
Why did the supply chain crisis get worse in 2021?
The second and larger wave of pressure came from demand. The BIS, in its Annual Economic Report of June 2022, wrote that "the pandemic-induced rotation of aggregate demand to goods from services, especially contact-intensive ones, proved surprisingly persistent." Households that could not spend on travel or restaurants bought goods instead, supported by fiscal and monetary policy. The supply system for goods could not expand fast enough. The BIS wrote that "bottlenecks emerged in a number of areas, including container shipping and semiconductors, leading to sharp price increases," and that disruptions had several parallel sources: in some cases natural disasters, conflicts or pandemic lockdowns, and in others the strength of demand.
The GSCPI climbed through the year: 2.27 in March 2021, 2.75 in June, 3.38 in September and the record 4.43 in December 2021.
What happened with chips and cars?
Semiconductors were the best documented bottleneck. A Federal Reserve Board note published on September 28, 2026 by Adrian Hamins-Puertolas and Maria D. Tito studied their effect on car production. It found that US light vehicle production had recovered to nearly pre-pandemic levels by the fourth quarter of 2020, then "plunged in early 2021," falling 20% below fourth-quarter 2020 levels by the third quarter of 2021. Against that late-2020 baseline, the cumulative production shortfall exceeded 2 million vehicles over 2021-2022.
The note traces the shortage to pandemic-era plant closures and shifting demand patterns. Lead times for microcontroller units, which it describes as 42% of the automotive chip market, roughly doubled from 15 weeks to 30 weeks, with sharp increases starting in the fourth quarter of 2020 and lasting through 2022. Automakers moved scarce chips toward higher-priced, higher-margin vehicles and removed some non-essential features. According to the note, production did not return to pre-crisis levels until early 2023.
The shortage showed up in consumer prices. In its June 2021 CPI release, BLS reported that the used cars and trucks index had risen 45.2% over 12 months, "the largest 12-month change ever reported for that index," and 10.5% in June alone, the largest monthly increase since the index was first published in January 1953. The used car increase accounted for more than one-third of the rise in the all items index that month. New vehicle prices rose 5.3% over the same 12 months.
How did the supply chain crisis affect inflation?
Supply problems were one of the main causes of inflation after COVID. Adam Shapiro of the Federal Reserve Bank of San Francisco estimated in June 2022 that supply factors explained about half of the rise in US PCE inflation above its pre-pandemic average, with demand responsible for about a third. He wrote that inflationary pressures would not completely subside until "labor shortages, production constraints, and shipping delays are resolved."
The BIS Bulletin on global supply chain disruptions, published on September 28, 2022, reached a similar view from the global side. It found that bottlenecks were "easing gradually, albeit unevenly across sectors and regions," but still significant relative to the historical norm, and that the intricacies of global value chains explained why the disruptions had lasted so long and hit the economy so hard. It named semiconductors as an example and warned that more protracted disruptions or new bottlenecks posed upside risks to inflation.
Russia's invasion of Ukraine in 2022 added a separate shock. The BIS wrote that the war "further disrupted the global supply of products such as wheat, oil, gas, nickel, palladium and fertilisers." That shock fell most heavily on energy and food prices, and it is a large part of the story of the UK cost of living crisis.
Is the supply chain crisis over?
By the New York Fed's measure, the 2021-22 crisis is over. The GSCPI fell from its December 2021 record to 0.98 by September 2022, turned negative in February 2023 (-0.26) and reached -1.59 in May 2023, meaning supply conditions were easier than normal. It stayed close to zero through 2024 and most of 2025.
| Month | GSCPI | Reading |
|---|---|---|
| December 2019 | 0.02 | Normal |
| April 2020 | 3.34 | First lockdown spike |
| December 2021 | 4.43 | Record high |
| September 2022 | 0.98 | Easing |
| February 2023 | -0.26 | Below average |
| May 2023 | -1.59 | Well below average |
| April 2026 | 1.85 | Above average |
| August 2026 | 1.06 | Above average |
Pressure picked up again in 2026. The index was 1.85 in April 2026, the highest reading since mid-2022, and 1.06 in August 2026. Both are above average but far below the 2021 peak. One caveat applies to recent readings: the New York Fed has noted that since November 6, 2025 it has been published with limited data because some necessary data were suspended.
What did the supply chain crisis change?
The BIS bulletin pointed to concentration in sectors such as semiconductors as a reason the disruptions lasted so long, and the Fed note showed how a shortage of one component held back car production for two years. The episode also left a mark on prices that did not reverse when the pressure index returned to normal: US consumer prices overall were 28.9% higher in August 2026 than in February 2020 (BLS data). For how this fed into the wider economy, see the COVID recession and the 2020 stock market crash, and for a quieter way prices rose, shrinkflation.
Questions readers ask
What caused the supply chain crisis?
Official analyses describe a surge in demand for goods meeting a supply system disrupted by the pandemic. The BIS pointed to a persistent shift in spending from services to goods and to bottlenecks in container shipping and semiconductors. A Federal Reserve note traced the chip shortage to pandemic-era plant closures and shifting demand.
When was the supply chain crisis at its worst?
By the New York Fed's Global Supply Chain Pressure Index, December 2021. The index reached 4.43, meaning pressures were more than four standard deviations above the historical average. The previous high before the pandemic, in 2011, was 1.58.
Is the supply chain crisis over?
The 2021-22 crisis is over by the New York Fed's measure: the index fell below its historical average in February 2023. It was 1.06 in August 2026, above average but far below the 2021 peak. The New York Fed has noted that since November 2025 the index has been published with limited data.
Why were there car shortages in 2021?
A Federal Reserve note found that semiconductor shortages cut US light vehicle production 20% below late-2020 levels by the third quarter of 2021, with a cumulative shortfall of more than 2 million vehicles over 2021-2022. Used car prices in the CPI rose 45.2% in the year to June 2021.
Sources
- Federal Reserve Bank of New York, Global Supply Chain Pressure Index (GSCPI), accessed October 6, 2026
- Federal Reserve Bank of New York, Liberty Street Economics, A New Barometer of Global Supply Chain Pressures, January 4, 2022, accessed October 6, 2026
- BIS, Annual Economic Report 2022, Chapter I: Old challenges, new shocks, accessed October 6, 2026
- BIS Bulletin No 61, Global supply chain disruptions: evolution, impact, outlook, September 28, 2022, accessed October 6, 2026
- Federal Reserve Board, FEDS Notes, When the Chips Went Down: Motor Vehicle Production and the 2021-2022 Semiconductor Shortages, September 28, 2026, accessed October 6, 2026
- BLS, Consumer Price Index news release, June 2021, accessed October 6, 2026
- Federal Reserve Bank of San Francisco, How Much Do Supply and Demand Drive Inflation?, June 21, 2022, accessed October 6, 2026